MySuper is the default option chosen if no decision is made on an asset allocation choice within a superfund. The default option of MySuper is the Balance option, which is primarily a 60/40 portfolio : 60% growth assets and 40% defensive assets. Currently, 26.9% of all total superannuation assets are held in the default MySuper option[1].
This strategy looks to overcome consumer behavioural inertia in selecting the optimum asset allocation strategy, based on age. We propose an automatic switching of asset allocation based on age as seen below:
| Age Range | Asset Allocation Choices |
| Below 55 | Growth |
| Between 55 and 70 | Balance |
| Over 70 | Conservative |
Default options target the widest possible audience with homogeneous preferences and circumstances, where the audience has limited decision-making expertise. It attempts to solve for the majority within the wider choice architecture model. Choice architecture needs to allow for heterogeneous preferences, allowing those to opt out of the default option when looking for a greater variety of choices. This follows the philosophy of paternalistic liberalism[2], caring for those who choose not to decide, while giving agency to those who do.
MySuper was initially designed to focus on cost reduction to the consumer in terms of fees and needless features. However, using the framework above, giving context to aged-based considerations, a better design could be implemented to increase its ‘fit for purpose’ functionality by introducing one simple step, aged-based asset allocation switching.
This solution agrees with Treasury’s MySuper Default option in its efficacy of use, but it can be improved to suit the wider target audience. Considering that the younger demographic will more likely ‘choose’ the default option, their option should be the highest-return option possible to exploit the power of compounding.

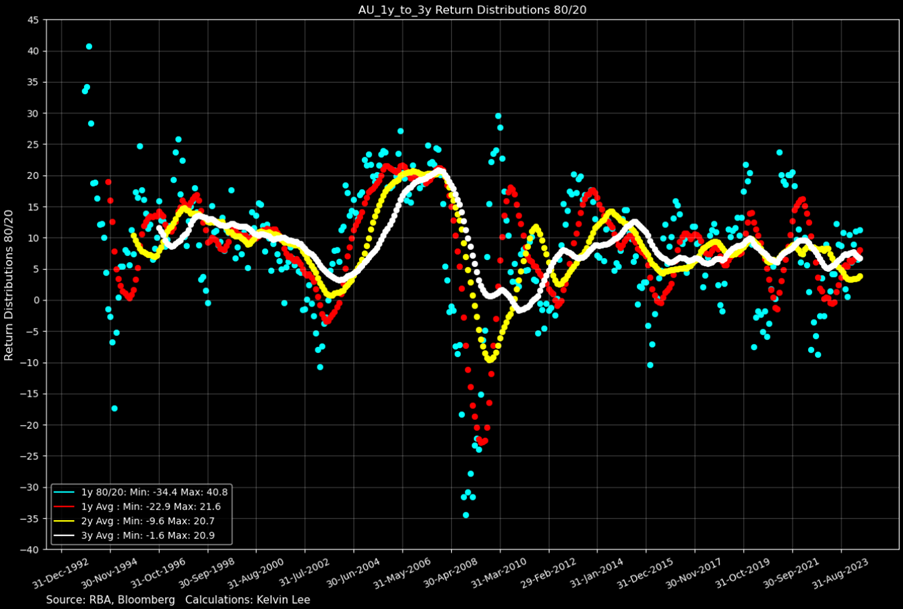
Above is the return dispersion of an 80/20 Growth portfolio (ASX200/10y Bond proxy portfolio) with 1-year to 3-year average returns. The Blue dots represent any point in time 1 year returns, following down to the 3-year average, which is the white scatter plot, which almost resembles a line.

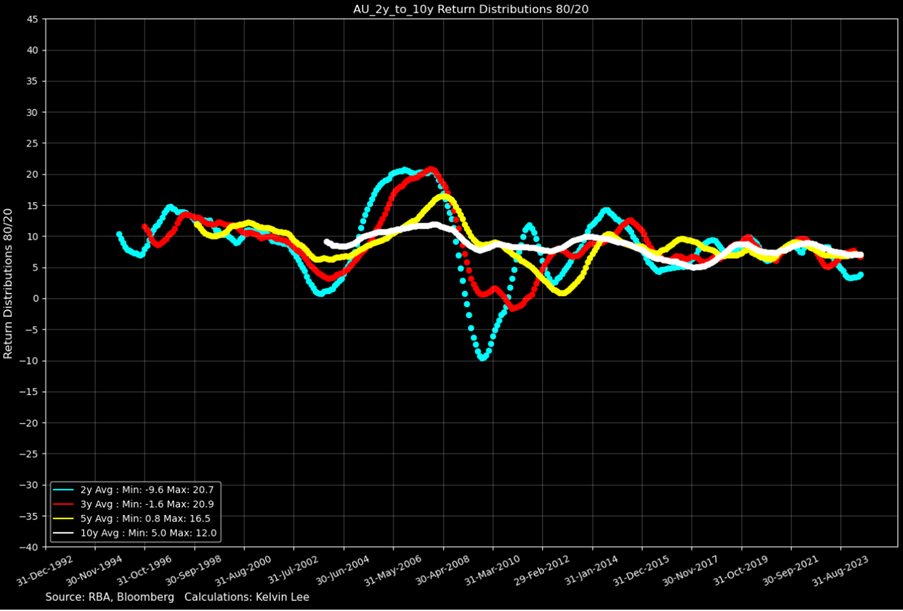
Above is 2-year to 10-year average returns.

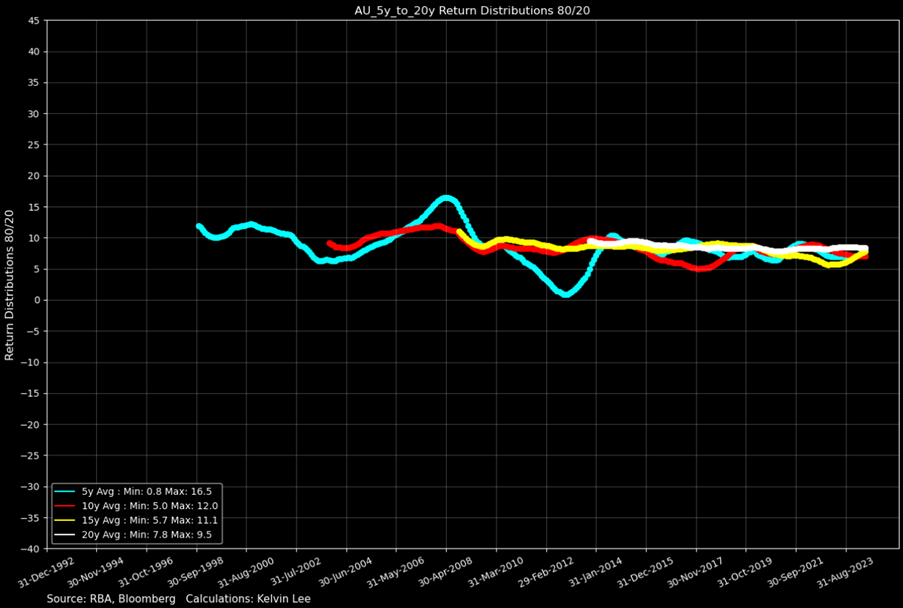
Above is 5-year to 20-year average returns.
From the progression of the charts, the average return of the strategy is more consistent the longer the timeframe chosen. Following this methodology, even a low-risk consumer, with a long enough time to retirement, would be well served in an 80/20 Growth Strategy, especially in the earlier years, as the average long-tern return is very stable, and the return variance is very low.
If access to super is 10+ years away, consumers would be better suited to choosing a higher-return asset allocation strategy. Moving from Growth to Balance and ultimately to Conservative is done to limit variance as consumers approach retirement. The need for stability of returns overcomes the need for higher average return. This automatically overcomes the behavioural biases above by embedding this functionality into the default option.
Another feature which is not readily visible is the return distribution. A Monte Carlo simulation was run where the standard deviation parameters were increased by a factor of 3,5 and 10. Over 10,000 iterations, the TD strategy outperformed Balance as volatility increased. This implicitly shows that the performance of TD is more robust as volatility increases, thus protecting the consumer from volatile markets as they approach retirement.

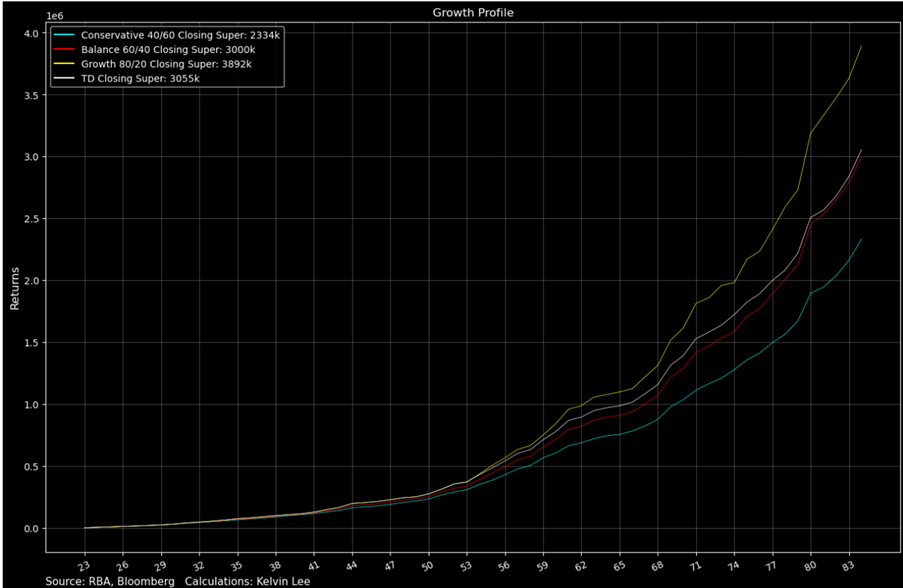
By using an automatic aged, based asset allocation strategy, TD Closing Super, white line, outperforms Balance 60/40 Closing Super, red line.
[1][1] https://www.apra.gov.au/annual-mysuper-statistics
[2] Thaler, R.H. (2008) Nudge : improving decisions about health, wealth, and happiness / Richard H. Thaler, Cass R. Sunstein. Yale University Press

