Great audio by Steve Chandler, please see below for his Linkedin profile and the mp3.
In attempting to translate one’s expectation into an agreement, it gives the expectation a reality test. If the expectation can be accommodated or translatable into reality, it is feasible. If the expectation cannot transition to reality, it requires modification or elimination. Depending on the person and expectation, the modification or deletion could be a herculean effort. However, changing their environment/reality to accommodate their expectation, could also be a herculean effort or an impossibility. Cognitive dissonance will remain if both are left unsettled. Depending on the situation, from an energy/resource/effort perspective, it is often always easier to change or eliminate one’s expectations.
MySuper is the default option chosen if no decision is made on an asset allocation choice within a superfund. The default option of MySuper is the Balance option, which is primarily a 60/40 portfolio : 60% growth assets and 40% defensive assets. Currently, 26.9% of all total superannuation assets are held in the default MySuper option[1].
This strategy looks to overcome consumer behavioural inertia in selecting the optimum asset allocation strategy, based on age. We propose an automatic switching of asset allocation based on age as seen below:
Age Range
Asset Allocation Choices
Below 55
Growth
Between 55 and 70
Balance
Over 70
Conservative
Default options target the widest possible audience with homogeneous preferences and circumstances, where the audience has limited decision-making expertise. It attempts to solve for the majority within the wider choice architecture model. Choice architecture needs to allow for heterogeneous preferences, allowing those to opt out of the default option when looking for a greater variety of choices. This follows the philosophy of paternalistic liberalism[2], caring for those who choose not to decide, while giving agency to those who do.
MySuper was initially designed to focus on cost reduction to the consumer in terms of fees and needless features. However, using the framework above, giving context to aged-based considerations, a better design could be implemented to increase its ‘fit for purpose’ functionality by introducing one simple step, aged-based asset allocation switching.
This solution agrees with Treasury’s MySuper Default option in its efficacy of use, but it can be improved to suit the wider target audience. Considering that the younger demographic will more likely ‘choose’ the default option, their option should be the highest-return option possible to exploit the power of compounding.
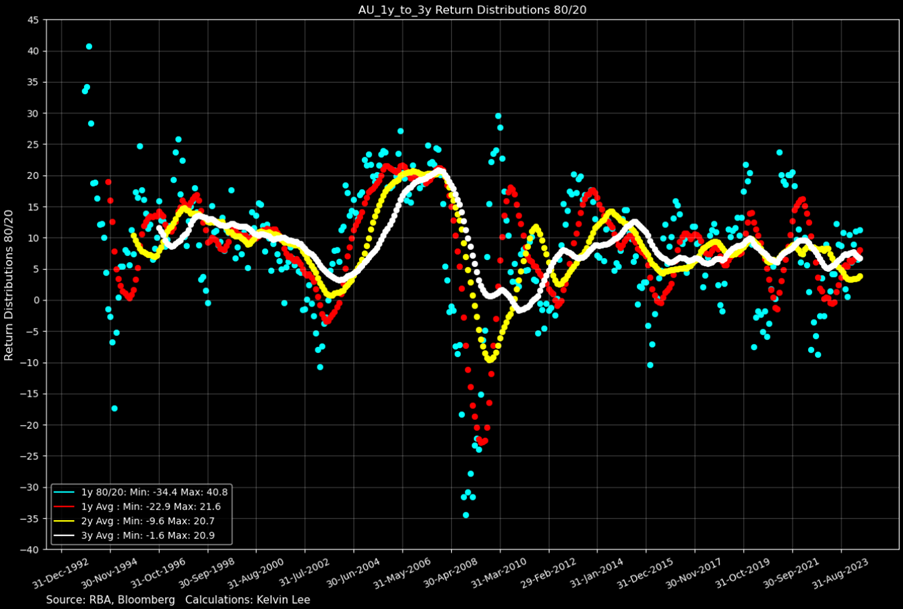
Above is the return dispersion of an 80/20 Growth portfolio (ASX200/10y Bond proxy portfolio) with 1-year to 3-year average returns. The Blue dots represent any point in time 1 year returns, following down to the 3-year average, which is the white scatter plot, which almost resembles a line.
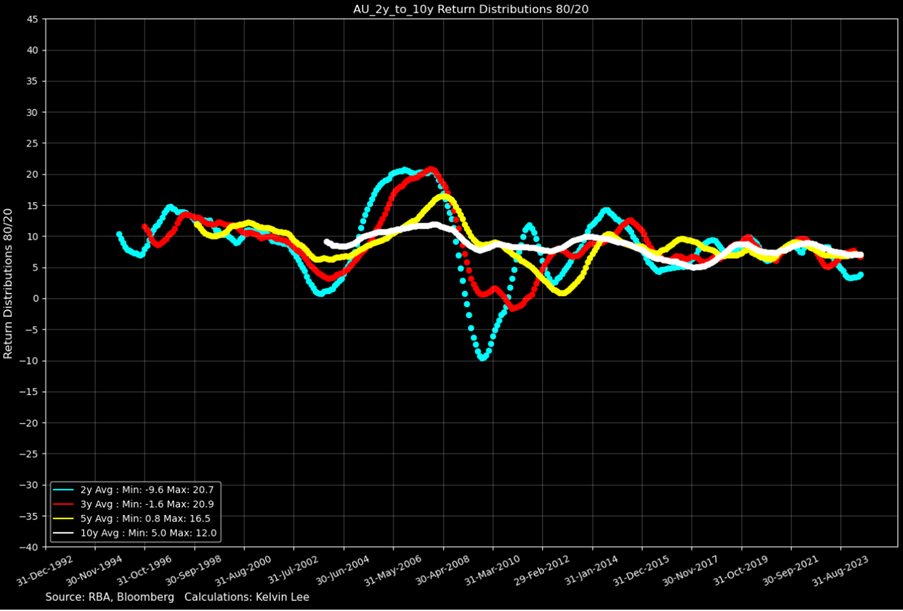
Above is 2-year to 10-year average returns.
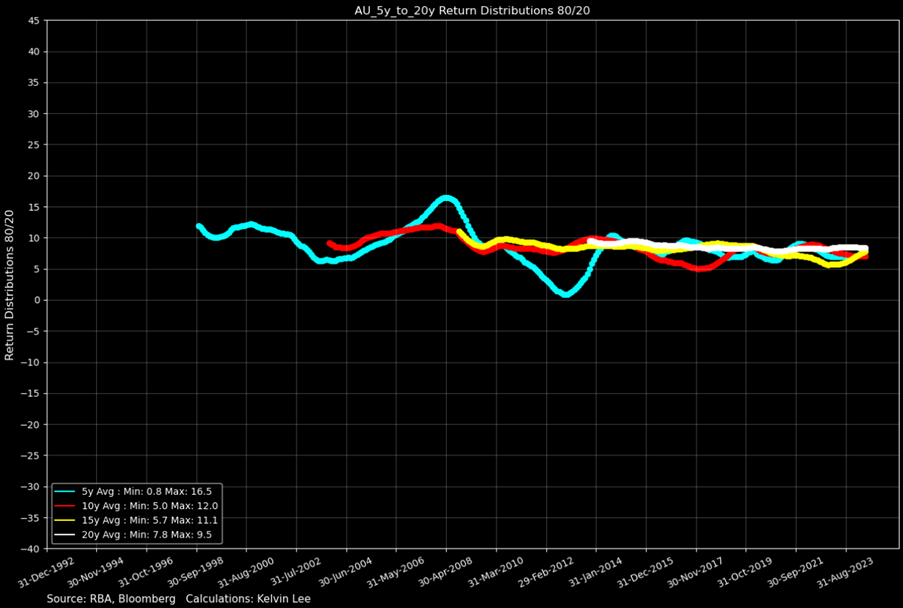
Above is 5-year to 20-year average returns.
From the progression of the charts, the average return of the strategy is more consistent the longer the timeframe chosen. Following this methodology, even a low-risk consumer, with a long enough time to retirement, would be well served in an 80/20 Growth Strategy, especially in the earlier years, as the average long-tern return is very stable, and the return variance is very low.
If access to super is 10+ years away, consumers would be better suited to choosing a higher-return asset allocation strategy. Moving from Growth to Balance and ultimately to Conservative is done to limit variance as consumers approach retirement. The need for stability of returns overcomes the need for higher average return. This automatically overcomes the behavioural biases above by embedding this functionality into the default option.
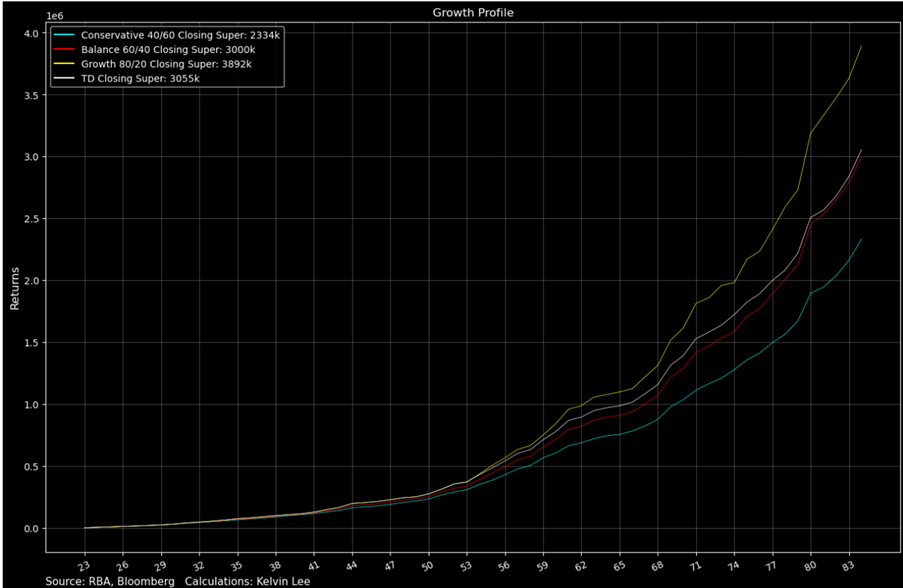
Another feature which is not readily visible is the return distribution. A Monte Carlo simulation was run where the standard deviation parameters were increased by a factor of 3,5 and 10. Over 10,000 iterations, the TD strategy outperformed Balance as volatility increased. This implicitly shows that the performance of TD is more robust as volatility increases, thus protecting the consumer from volatile markets as they approach retirement.
By using an automatic aged, based asset allocation strategy, TD Closing Super, white line, outperforms Balance 60/40 Closing Super, red line.
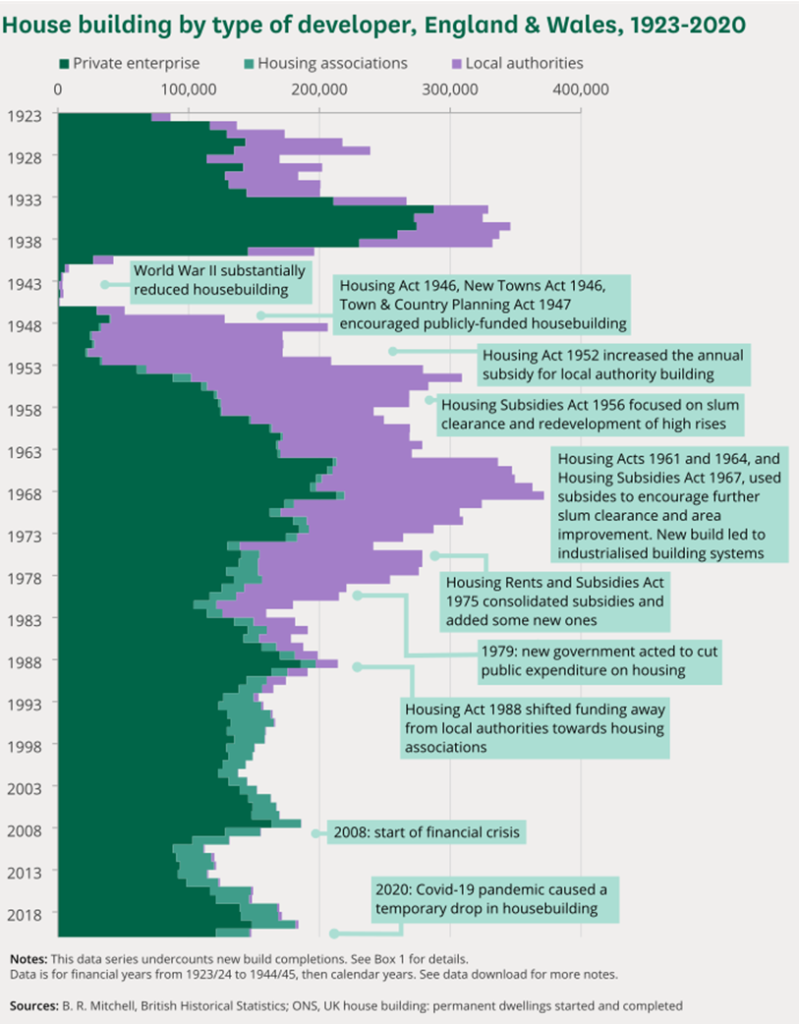
Great chart from Marc Rubenstein’s netinterest on SubStack, title “Housing the Young” , 28Jun2024.
The narrative of affordable housing, especially for the younger cohort, is becoming louder in the media, all across the world. From potential rent controls in Berlin, reducing local council planning friction and more social, affordable and public housing, in the UK and Australia.
The chart is interesting if we just focus on the purple section and tie that back to economic regimes. Post WW2 till the Great Inflation (circa 1945-1980) saw a huge boom in local authority supply of housing, marking big government and more Keynesian direct policies. Post-1980, we saw a wave of privatization under the Thatcher-Reagan Friedmanite policies, leading to less government-directed policies and a concurrent drop off in local authority housing supply.
I believe that the purple wave will develop again over the coming years. Similar policies in the past such as subsidies, price controls, zone initiatives, new public housing, and higher densities will all come.
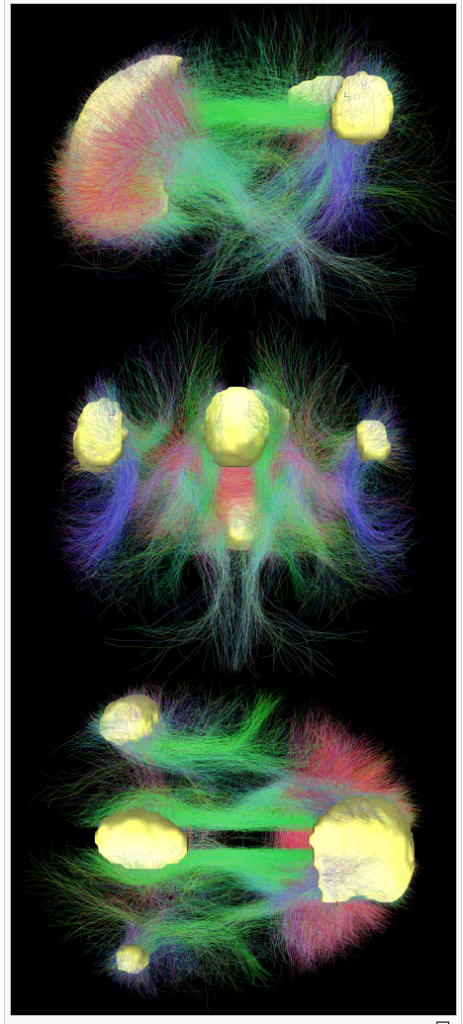
“In neuroscience, the default mode network (DMN), also known as the default network, default state network, or anatomically the medial frontoparietal network (M-FPN), is a large-scale brain network primarily composed of the dorsal medial prefrontal cortex, posterior cingulate cortex, precuneus and angular gyrus. It is best known for being active when a person is not focused on the outside world and the brain is at wakeful rest, such as during daydreaming and mind-wandering. It can also be active during detailed thoughts related to external task performance. Other times that the DMN is active include when the individual is thinking about others, thinking about themselves, remembering the past, and planning for the future.”
Below is an image of the brain that is active when in DMN. When I meditate in the mornings, I do feel a sensation at the back of the head when it is active. It’s fascinating that you can feel it firing during ‘wakeful rest’.
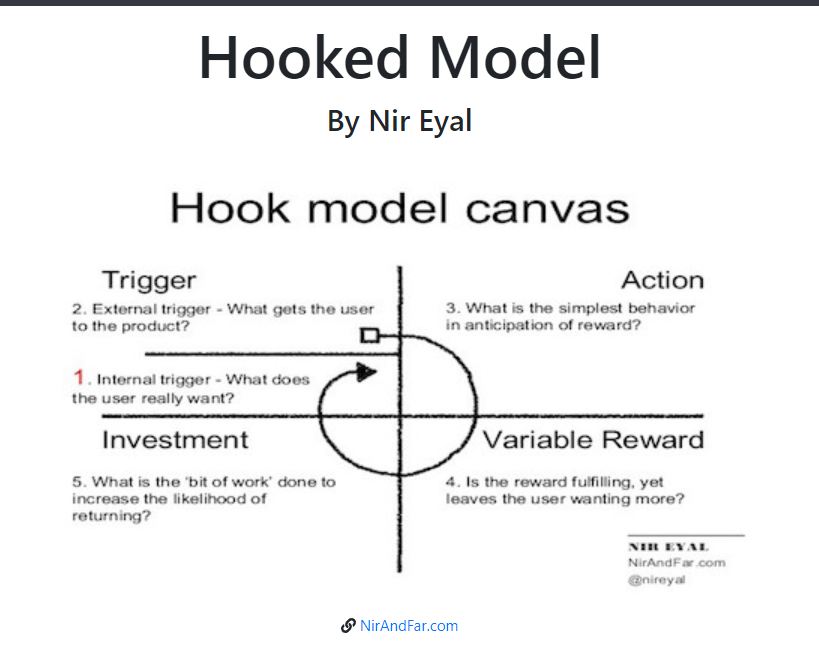
Rather than using conventional feedback loops, companies today are employing a new, stronger habit-forming mechanism to hook users—the Hooked Model.
At the heart of the Hooked Model is a variable schedule of rewards: a powerful hack that focuses attention, provides pleasure, and infatuates the mind.
Our search for variable rewards is about an endless desire for three types of rewards: those of the tribe, the hunt and the self.
Illusion of control is where an individual feels that they can control an outcome in their environment[1], which leads to overconfidence (Phase 1 in the Dunning Krueger Effect[2]). For investors, this leads to high degrees of portfolio concentration, increased trading frequency and more leverage.
The illusion of control is prevalent amongst traders, especially novice traders who believe that whatever simplistic process works ad infinitum. If they survive and develop some tenor in the profession, they tend to use multiple heuristics or develop a more systematic approach, which can be fully autonomous.
As traders develop along the Dunning Krueger Curve, those who survive recognise that there is no control over the situation except their personal reaction function.
Restrictions on bet size/individual weightings, stop loss exits or concentration limits or other such risk management strategies can limit the worst of it, as they hard code risk management into the process but the frequency of trading is only ameliorated through time and pain. A greater appreciation of randomness comes with age.
Not being religious, it’s ironic that one of my favourite quotes comes from the Bible:
“I returned, and saw under the sun, that the race is not to the swift, nor the battle to the strong, neither yet bread to the wise, nor yet riches to men of understanding, nor yet favour to men of skill; but time and chance happened to them all.”[3]
[1] Langer, E. J. (1975). The illusion of control. Journal of Personality and Social Psychology, 32(2), 311-328.
This is a situation where an individual feels mental discomfort due to contradictory beliefs, attitudes or behaviours which results in a change of beliefs or attitudes to harmonise this friction[1]. Individuals are motivated to calm this dissonance by changing their behaviour, attitudes or actions. This involves a strong form of confirmation bias[2], which allows the individual to filter any non-conforming information or evidence, when increased dissonance is experienced.
This is commonly seen in cults. Friction between cult beliefs and reality causes cognitive dissonance amongst members of the cult. Members filter non-conforming information to the extent that they stop associating with anyone carrying a contradictory belief. They cut off family and friends from the social circle and fill it with individuals who share the same beliefs. This creates an echo chamber within an epistemic network, which reinforces their belief, calming their cognitive dissonance. A milder variation of this can be seen through society with such conspiracy as Covid-19 or 5G[3].
Humans desire for consistency and habit are directly rooted in our demand for less cognitive load, a ‘laziness’ which pushes us to use heuristics, which can push us to change habits, behaviours and actions, to decrease the load that cognitive dissonance places on our amygdala.
[1] Festinger, L. 1919-1989. (1962) A theory of cognitive dissonance / Leon Festinger. Stanford University Press. Available at: https://research.ebsco.com/linkprocessor/plink?id=9a1ee125-ca54-3298-a920-ea3cb9caf99e (Accessed: 7 May 2024).
[2] Confirmation bias refers to a tendency to search for, interpret, favour, and recall information that supports existing beliefs, while ignoring any contradictory evidence or information.
Mental Accounting postulates that individuals focus on independent economic buckets instead of the overall economic outcome[1]. This is built upon the foundations of the framing effect in prospect theory, where an opinion is formed based on how the information is provided, a positive opinion correlates to positive information and vice versa.
This can be seen where individuals are more likely to spend their bonus as it is framed as a reward for hard work as opposed to their normal wage, which is framed as money for expenses.
Traders often take more risk when they are winning as opposed to when they are losing, the house money effect[2]. This is an inherent view that when they have more, they can bet more, however circumstances often change after a winning run and if bet sizes are larger than normal then losses would be larger than normal, a better strategy would be to bet consistently, providing that one has an edge.
[1] Thaler, R.H. (1999) ‘Mental Accounting Matters’, Journal of Behavioral Decision Making, 12(3), pp. 183–206. doi:10.1002/(SICI)1099-0771(199909)12:3<183::AID-BDM318>3.0.CO;2-F.
[2] Where individuals take greater risks with money they perceive as “gains” or “house money” than they would with their original investment, savings, or baseline wealth.