Grit: Self-Control and Perseverance

The current model of grit, where one uses the executive function, dominated by the pre-frontal cortex, to exert self-control and perseverance comes at a cost over time, as it degrades mental flexibility, causing stress from the failure to achieve goals. Pre-frontal cortex actions consume a lot of energy and by not developing emotional qualities such as compassion, gratitude, and pride to shore up self-control and perseverance, we are not fully using all the tools available to us for long term success. Gratitude increases trustworthiness. It enables individuals to be more honest. Compassion has similar traits, providing a sense of purpose and the ability to be effective. Compassion to oneself is also a principal factor in long term sustainability of grit as one is more forgiving of self-made errors and mistakes, which lessens internal self-criticism. Pride, in helping the tribe, increases diligence and motivation by admiration. By making these emotional traits the foundation of one’s self-control and perseverance, in conjunction with the executive function, one builds a more robust model for grit. 

From David DeSteno: Emotional Success (2018)

Insolvencies

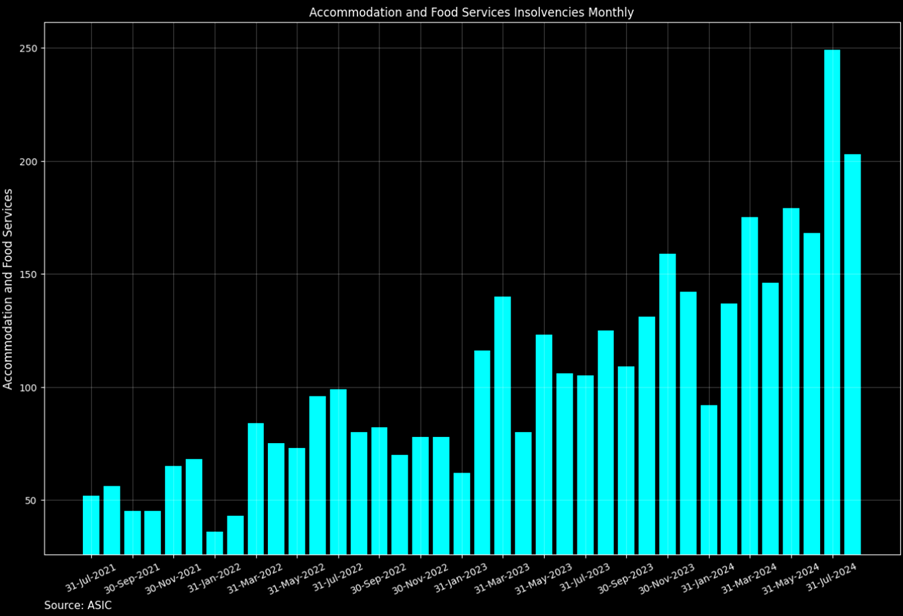
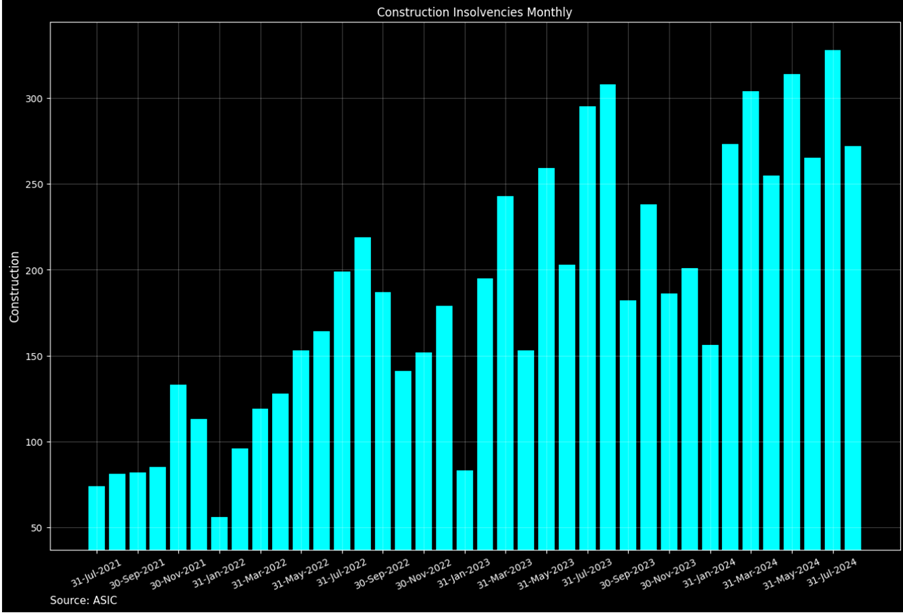
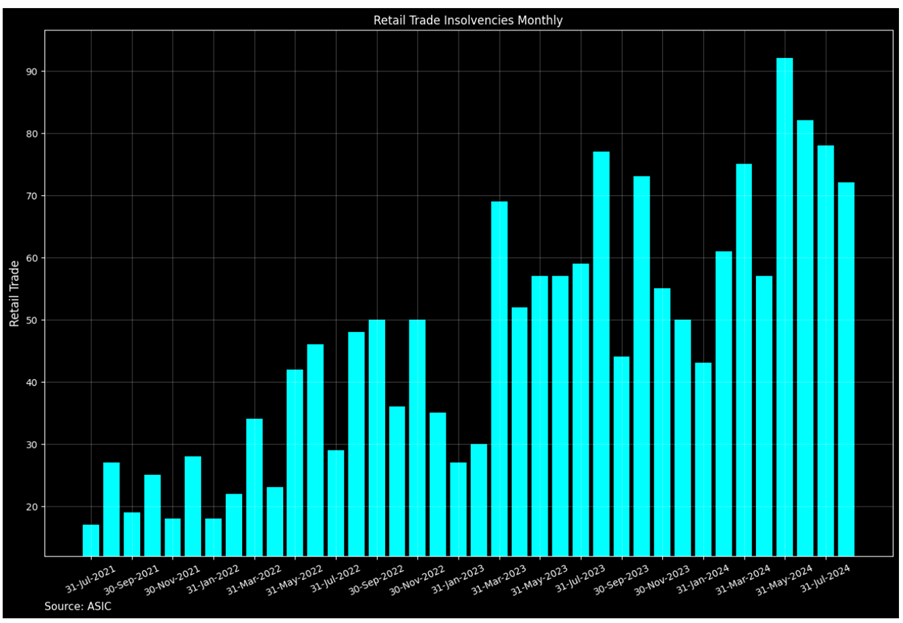
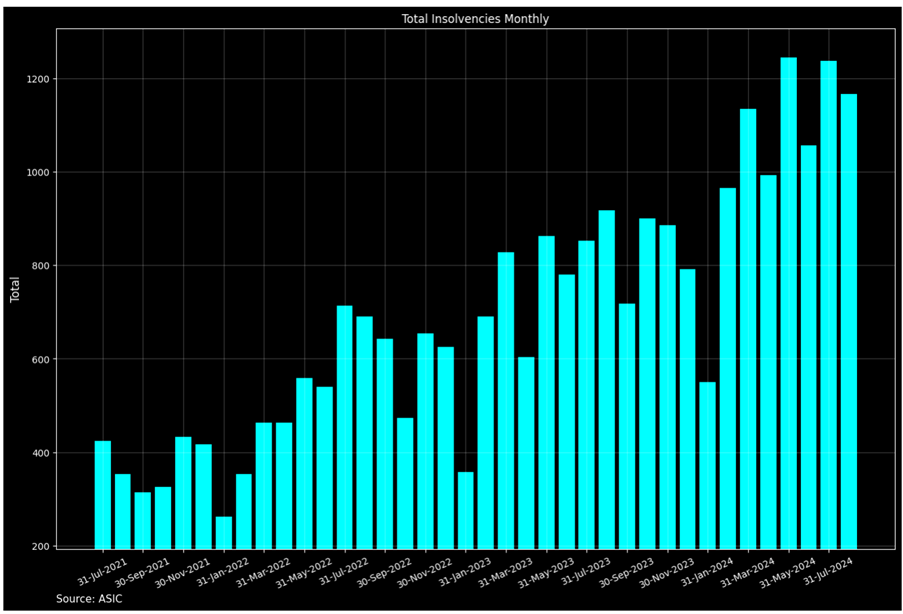
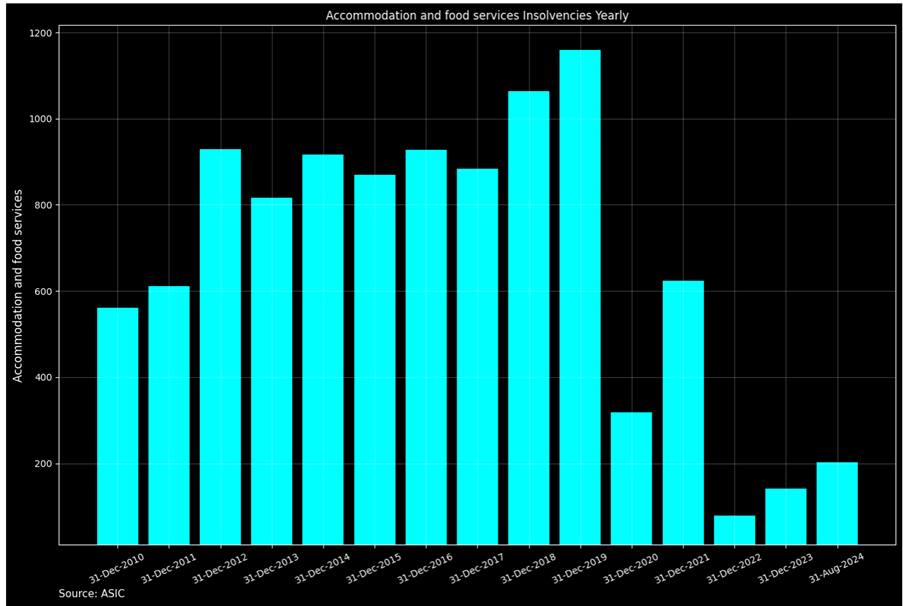
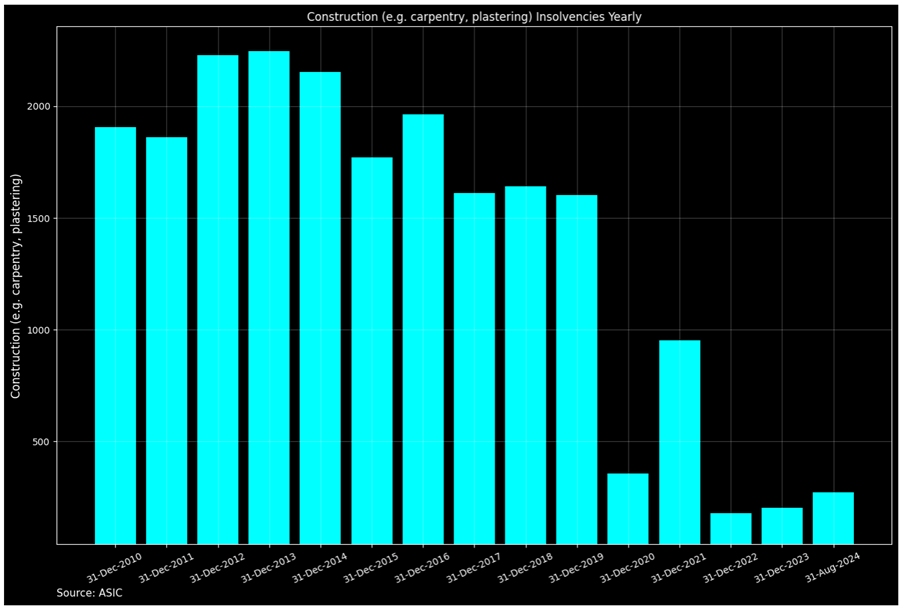
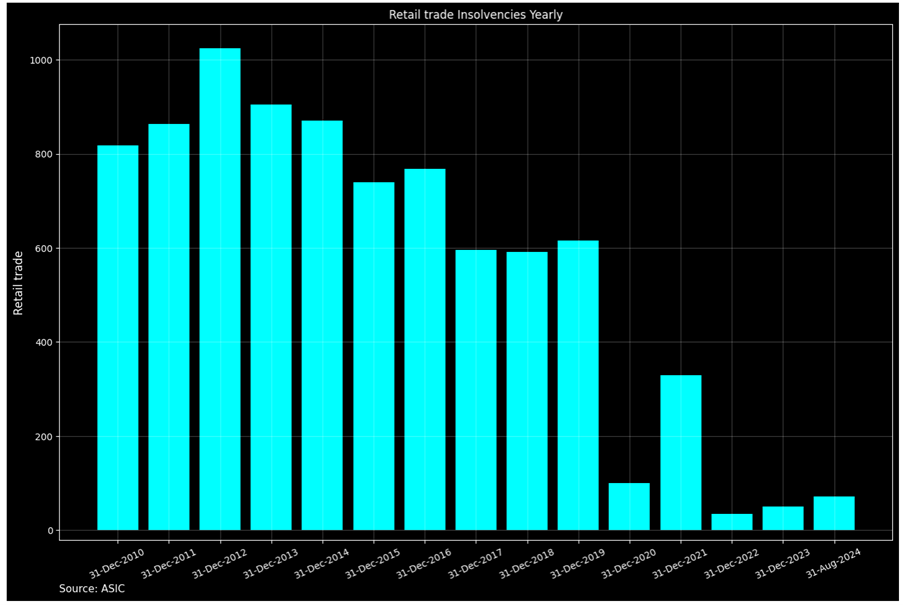
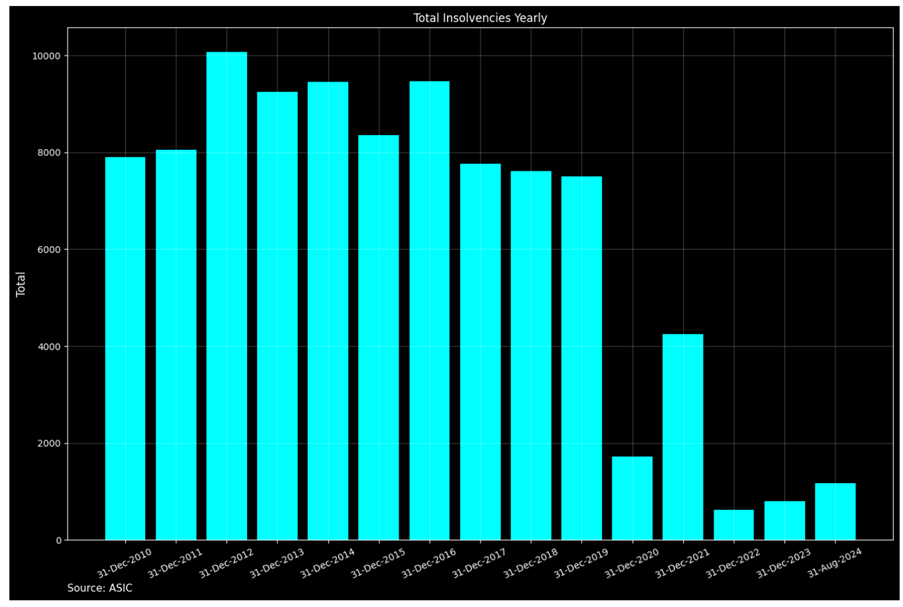
There have been quite a few articles in the press about construction, restaurant and retail trade insolvencies.  Below are monthly insolvency numbers for Accommodation and Food Services, Construction and Retail Trade, plus a total for all insolvencies, since 2021.  There has been an uptrend, but when you put it in the context of pre-Covid insolvencies statistics, a more surprising picture emerges – last 4 graphs.

Thucydides’ History: the Melian Dialogue

In perhaps the most famous passage in Thucydides’ History, the Melian Dialogue, the Commissioners of Melos assert a moral case in their defence against their Athenian invaders. They ‘invoke what is fair and right’ and declare to the Athenians that they ‘trust that the gods may grant us fortune as good as yours, since we are just men fighting against unjust.’

The Athenians, in reply, do not permit their hearts to be warmed by such moral sentiments. Instead, we witness raw power and cold, naked political realism as they inform the Melians that ‘you know as well as we do that right, as the world goes, is only in question between equals in power, while the strong do what they can and the weak suffer what they must.’

Melos fell. Thucydides notes rather breezily that after the Melian surrender, the Athenians ‘put to death all the grown men whom they took, and sold the women and children for slaves, and subsequently sent out five hundred colonists who settled the place for themselves.’ Defeat in war is always tragic and costly.

Foreword by Andrew Hastie

https://www.andrewhastie.com.au/destined_for_war

From: Destined for War: Can America and China Escape Thucydides’s Trap?

By Graham Allison

An Australian Housing Affordability and CGT Study

1.0     History of CG

On 20 September 1985, CGT was introduced by the Hawke/Keating[1] government.  Events after that date attract CGT while events before are not subjected to CGT.  Howard/Costello[3] thought the CGT discount would motivate households to invest in shares and lower the cost of capital[4]

2.0     Cost and Benefits of CGT Discount

The 50% CGT paired with negative gearing[5], provides a huge incentive for taxpayers (TP) to invest in residential property on a geared basis as the tax advantages are huge.  Furthermore, the gearing available to property investors (up to 90% of LVR[6]) is much higher than that available to other investments, such as stocks  (average LVR of 50% or less).  This generated a huge incentive for ordinary Australians to invest in residential property.  However, this benefit primarily flowed to the top 2 deciles of the population as seen below:

Both negative gearing and the CGT discount attributed to property investments are estimated to cost the budget 5.7b and 5.22b respectively, for FY2024[7] , which is 38.6% of the projected FY25 budget deficit[8].  This is expected to grow to 14.5b and 8.35b in FY2035.

While attempting to encourage capital formation and to substitute the loss of indexation, Howard/Costello have inadvertently created a policy that mainly benefits the rich at the expense of the poor.

3.0     Housing Affordability

CoreLogic National Median House Values:

The housing affordability metric most commonly used is the dwelling-to-income ratio (DIR) which is the average dwelling price divided by the average household income, assumed to be 2 individuals on average annual wage[9].  This is seen as the red line in the graph below, with the blue line being the average residential dwelling mean price in Australia and the green vertical line, the date that CGT discount was introduced.

This phenomenon of dwelling prices outstripping wages is only prominent from the mid to late 1990s

4.0     Drivers of House Prices

In the following section, we will examine the 4 common factors affecting dwelling affordability, the literature review around it, and the empirical evidence through the lens of the dwelling-to-price ratio reaction to each factor.

4.1     Migration

Net overseas migration (NOM) is one of the purported key drivers of dwelling price inflation.  NOM remained steady between 1948 to 2003 but doubled between 2005 and 2020[10].   According to ABS data, NOM averaged 48k p.a to 2003 and jumped to 106k p.a after 2003 supporting Kohler’s[11] claim.

Just looking at NOM alone is inadequate, as housing supply[12] plus domestic births and deaths need to be added back for a true picture of a dwelling surplus or deficit.  Furthermore, we have factored in building demolitions as well[13].

The grey vertical highlighted area in the graph above is where there is an acute supply deficit, which corresponds to the huge jump in NOM.  Dwelling price rises were similar to trend growth during this period and the DIR was stable through this period, which is strange, considering a huge jump in migration and the dwelling deficit. Dwelling prices should have jumped higher than trend growth for the supply deficit, but the data does not support this conclusion.

4.2     CGT 50% discount and Negative Gearing

Dailey et.la[14] calculates that halving the 50% CGT benefit and limiting negative gearing to passive income would decrease housing prices by 2%.   They point to some side effects of this policy such as TP holding onto property for longer periods to avoid crystalising CGT.   However, Falinski[15] argus that the wave of investor activity should have seen an equivalent wave of supply into the market to meet this demand.  None of the authors provide any strong evidence supporting their arguments.

Our approach analyses investor period-on-period (PoP)[16] credit growth to the introduction of the 50% CGT discount.  The introduction of the 50% discount should have sparked a wave of investor credit growth.

The green vertical line represents the introduction of the 50% CGT discount.  While we did see a rise in investor credit on a PoP basis for the next period after the 0% CGT discount introduction, the rise was not large or out of the ordinary with other periods.  Furthermore, during the next 2 years (highlighted area above), investor credit growth slowed, dwelling price growth was below trend and DIR dropped.  From the lens of DIR, 50% CGT discount does not look to be a determining factor in dwelling prices.

Furthermore, when APRA limited investor loan growth in 2014, constricting the supply of credit, investor credit growth collapsed (highlight area above)[17].  This caused dwelling prices and DIR to fall.  Although this is just one sample, credit availability does seem like a plausible factor in determining prices and DIR.

4.3     Fiscal Injections: First Home Buyer Grant (FHBG)

After the 50% CGT discount was introduced together with the GST[18], Howard faced pressure on the electoral front and in July 2000, he introduced a $7k first home buyers grant without a means test.  He increased this to $14k in March 2001.  It dropped to 11k in December 2001 and finally back to $7k in June 2002.  This was a direct fiscal injection into the residential housing market.

During the GFC[19] from October 2008 till June 2009, Rudd[20] increased the FHBG back to $14k with a special tier of $21k for newly built homes[21].

Finally, COVID fiscal injections, such as Job Keeper, which injected $89b (4.5% of 2020 GDP) into the economy, together with second-round Job Seeker top-ups, injected a further $66b into the economy, could be construed as quasi-FHBG, as consumer spending was limited during the lockdown, forcing stimulus into the housing market.

Eslake has been a fierce critic of government housing policy and their obsession with FHBG[22].  He shows a huge jump in fiscal injections into housing post-2000 as seen below.

In our analysis, all 3 periods mentioned above (highlighted) have resulted in a rise in PoP total credit growth, dwelling prices and DIR, during and after.

Anecdotally, this has been the best factor so far in explaining dwelling prices and DIR, corroborating Eslake’s findings.

4.4     Rezoning and Density Limits

There is general agreement in the literature that rezoning and increasing density would alleviate the supply constraints and increase dwelling supply.   Kendall has postulated that zoning has the following impact on dwelling values[23].

As councils control zoning and represent their constituents, who do not want to see increased density in their suburbs (NIMBY-ism[24]), they act like a cartel restricting supply and drive up prices.  There have been greater federal and state-level initiatives to build more houses[25], but there has been a lack of details on council-level initiatives.  Furthermore, there is no study in Australia to show the efficacy of such a program in improving the DIR. 

An example of upzoning that can be examined is Auckland’s 2016 policy, where they upzoned three-quarters of Auckland’s residential area[26].  This has increased dwelling permits in upzoned areas as seen below[27].

Increased multi-unit housing availability:

And lowered rents:

Finally, it slowed dwelling price appreciation in comparison to Wellington and Christchurch.

The yellow vertical line above is the beginning of Auckland’s upzone policy, which seemed to have stopped the rise in its DIR.  Covid stimulus by the NZ government, highlighted in green, drove up DIR, but perhaps rezoning has increased supply elasticity in Auckland, allowing the DIR to come back at a faster pace in comparison to the other 2 cities.  As this is a one-sample study, its difficult to know.

5.0     Conclusion

From our analysis, through the lens of DIR and its reaction to the four factors presented, on the balance of probabilities, direct fiscal injections seem to be the primary diver of housing affordability


[1] Bob Hawke/Paul Keating.

[2] Indexed to the consumer price index (CPI),

[3] John Howard/Peter Costello

[4] Kohler, A. (2023) The Great Divide Australia’s Housing Mess and How to Fix It; Quarterly Essay 92. Black Inc. Available at: https://research.ebsco.com/linkprocessor/plink?id=80aaa991-eaeb-3aae-8555-590cb1a2faf7 (Accessed: 4 August 2024).

[5] Losses on investments can be offset against ordinary income such as wages, thus reducing a TP’s assessable income and lowering overall tax paid

[6] Loan to Value

[7] Parliamentary Budget Office (2024) Cost of Negative Gearing and Capital Gains Discount Tax, advice provided to Adam Brandt MP 17Jun 2024.

[8] https://budget.gov.au/

[9] The latest average weekly earnings for all employees by the ABS  for May 2024 is $1,480.90, which makes the average annual wage $76,960.

[10] Kohler, A. (2023) The Great Divide Australia’s Housing Mess and How to Fix It; Quarterly Essay 92. Black Inc. Available at: https://research.ebsco.com/linkprocessor/plink?id=80aaa991-eaeb-3aae-8555-590cb1a2faf7 (Accessed: 4 August 2024).

[11] Ibid

[12] ABS Building Approvals https://www.abs.gov.au/statistics/industry/building-and-construction/building-approvals-australia/latest-release

[13] Data only from 2016-2023, we used an average of that dataset for the prior years.

[14] Dailey, J, and Wood,D. (2016) ‘Hot Property Negative gearing and capital gains tax reform’.  Grattan Institute.

[15] Falinski, J et.la  (2022) ‘The Australian Dream: Inquiry into housing affordability and supply in Australia’.  House of Representatives Standing Committee on Tax and Revenue, Australia

[16] Semi-Annual

[17] https://www.apra.gov.au/news-and-publications/apra-announces-plans-to-remove-investor-lending-benchmark-and-embed-better

[18] Goods and Services Tax

[19] Global Financial Crisis

[20] Kevin Rudd

[21] https://www.news.com.au/finance/real-estate/first-home-boost-will-end-in-june-rudd/news-story/eed70a7bc5626e3df15e5b29c0892124

[22] Eslake, S. (2013) ‘Australian Housing Policy: 50 Years of Failure’, Submission to the Senate Economics References Committee.

[23] Kendall, R., Tulip, P., The Effect of Zoning and House Prices, Research Discussion paper 2018-03, Reserve Bank of Australia 2018

[24] NIMBY: Not In My Back Yard

[25] https://www.pm.gov.au/media/new-funding-deliver-more-homes-australia#:~:text=The%20Albanese%20Labor%20Government’s%20Homes,turbocharge%20construction%20of%20new%20homes.

[26]https://onefinaleffort.com/auckland#:~:text=In%20November%202016%2C%20Auckland%20upzoned,Auckland%20Unitary%20Plan%20(AUP).

[27] Greenaway-McGrevy, R. and Phillips, P.C.B. (2023) ‘The impact of upzoning on housing construction in Auckland’, Journal of Urban Economics, 136. doi:10.1016/j.jue.2023.103555.

The Man in the Arena

It is not the critic who counts; not the man who points out how the strong man stumbles, or where the doer of deeds could have done them better. The credit belongs to the man who is actually in the arena, whose face is marred by dust and sweat and blood; who strives valiantly; who errs, who comes short again and again, because there is no effort without error and shortcoming; but who does actually strive to do the deeds; who knows great enthusiasms, the great devotions; who spends himself in a worthy cause; who at the best knows in the end the triumph of high achievement, and who at the worst, if he fails, at least fails while daring greatly, so that his place shall never be with those cold and timid souls who neither know victory nor defeat. – Theodore Roosevelt

ART moving those under 50 into High Growth from Balanced for its MySuper Option

Australian Retirement Trust (ART) plans to move 1.4m members[1] under 50 invested in the MySuper option from balanced to high-growth.  The MySuper default option is chosen for members if members do not elect an asset allocation strategy.  It is mostly the balanced option.  Whilst a good initiative from ART, it should be mandated by the government as part of its MySuper policy as it would be a better fit-for-purpose policy as we have previously argued[2].  This is especially true for the younger demographic who are decades away from retirement and more disengaged from super decisions.   Our age-based switching strategy suggestion (listed below) is not far from what was suggested by ART, except for the balance to conservative section, which ART did not elect to pursue.  We still think that going from balance to conservative has its advantages from a portfolio stabilization perspective, especially during the retirement phase of life when pension payment stability/ability takes precedence over accumulation.

Age RangeAsset Allocation Choices
Below 55Growth
Between 55 and 70Balance
Over 70Conservative

Furthermore, a government mandate age switching would preserve the homogeneity of the MySuper option, allowing for better apples-to-apples comparisons for the consumer.   Perhaps an industry norm will develop going forward.

https://www.afr.com/wealth/superannuation/why-this-super-fund-is-moving-younger-customers-into-a-riskier-option-20240809-p5k10t


[1] This represents 8% of the working-age population in Australia.

[2] https://bambootrading.com.au/aged-based-asset-allocation-strategy/

10 Stages of Genocide

  1. Classification.

‘Us & them” categorization

  • Symbolization.

Swastikas, Yellow Star

  • Discrimination.

Deny rights to other groups.

  • Dehumanization.

Equate other groups with vermin, diseases or insects.

  • Organisation.

By State, militia or paramilitary force.

  • Polarisation.

Propaganda that promotes extremism.  Laws forbidding intermarriage or social interaction.

  • Preparation.

Final solution paradigm.

  • Persecution.

Identified and separated.

  • Extermination.

Mass Killings aka genocide.

  1. Denial.

Deny that the crime has been committed.  Destroy the evidence.  Obfuscate the truth.

Dr Gregory H. Stanton Genocide Watch.

https://www.genocidewatch.com/tenstages